Business Jet Depreciation: The New Normal
In 1987 Gulfstream’s GIV entered service and in that same year it set 22 world records in its class, flying west around the world in 45 hours and 25 minutes. The next year the aircraft set another 11 more world records flying east around the world.
The late eighties were a much different time than today, the US economy was the single dominant driver for business jet demand and with the technology boom of the 1990s right around the corner demand would remain consistently strong for an unprecedented amount of time.
In 1987 you could buy a new GIV for about $17.8 million (about $42.75 million in today’s dollars). You could have flown that jet about 400 hours a year (typical utilization) for the next 15 years and then sold it in 2002 for about what you bought it for. The same value retention scenario during that time span also holds true for a 1988 Falcon 900.
In today’s world this would be equivalent to have bought a new GV-SP in 2002 for about $32.0 million ($42.6 million in today’s dollars) and selling it today with about 5,000 hours for about $32.0 million. Sounds crazy – Right? A 2002 GIV-SP in today’s market with 5,000 hours would sell in the $7.0 million range.


What has changed? The market dynamics of supply and demand have finally engulfed the once dynamically growing and emerging industry of business aviation and it is exhibiting characteristics of a mature market.
From the 30,000-foot level, over the last 30 years the growth of business jets in operation has outpaced the growth of the GDPs of the 10 largest economies (adjusted for inflation) and world population. In addition the number of Billionaires in the world increased by about 1,686 (140 to 1,826) while the number of Business Jets in operation increased by 15,967 (6,007 to 21,974) - nearly 9.5 times as many.
Over the past few years OEMs have seemed to take a more even keeled approach to production rates and the market is experiencing business jet annual depreciation in the 7%-12% range.
There are still a dwindling few that are waiting for used business jet values to come back but with each passing day of consistent annualized depreciation rates in the 10% plus or minus range, even those optimistically waiting for values to come back are beginning to accept the new normal regarding depreciation.
The days of Banks and Financial Institutions utilizing 3%-5% annual depreciation rates to predict residual values and offering operating lease rate factors based on this anticipated depreciation are a thing of the past. An analysis of the inventory levels of off-lease aircraft of the two largest Financial Institutions doing operating leases pre the 2008 economic downturn will reveal historic high inventory levels with more aircraft coming every month below their initially forecasted residual values.
Analysis – The Numbers
We analyzed historical depreciation rates for a broad variety of business jets from 2003 to 2016 based on quarterly average aircraft values provided by Aircraft Blue Book. In our analysis, we were able to identify different aircraft depreciation rates for different aircraft models and vintages, as well as differences in the aircraft depreciation during certain cycles, i.e. pre and post the 2008 financial crisis.
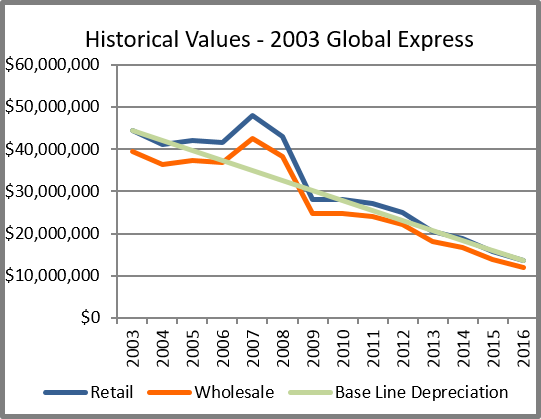
As a result of our analysis and experience in the market we believe a good way to approach the depreciation of business jets is to think of “Base Line” depreciation. Our view of Base Line depreciation is essentially straight-line depreciation like the green line in the adjacent graphs over a certain period of time. We recognize that aircraft do not depreciate in straight lines however over time the value of the aircraft should generally follow this Base Line depreciation. In the graph to the right you will see that from 2003 to the end of 2016 the Global Express value went from $44.4 million to $13.5 million, which is an average annualized depreciation of about 8.0%. You can see that during that span the aircraft’s value was both above and below what we would call Base Line depreciation.
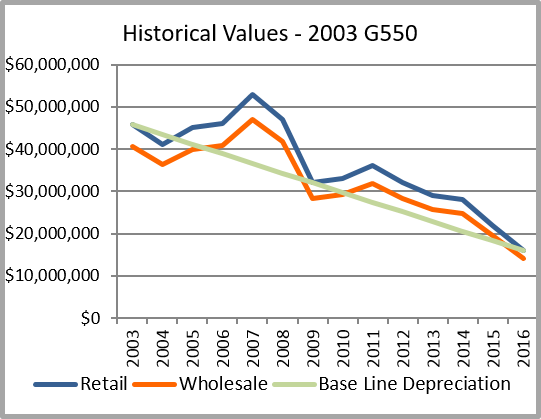
Every aircraft type depreciates differently but all are affected by economic cycles, OEM production rate, retail prices and the introduction of engineering and technology improvements. For this article we have shown 4 models and their values from 2003 till the end of 2016. In our overall analysis we looked at 12 different business jet types over a similar span of time and found an average annual depreciation of 9.25%.
Anyone who attempts to asses current and residual values for business jets will agree that it can be more “Art” than “Science”. Given this we believe that our analysis suggests that a plunge of aircraft values or more accurately stated, the rapid correction in values, seen in the
2008 and 2009 time frame is unlikely to happen in the near future. Our belief is that due to the fact that over the last several years business jets have steadily depreciated along what we would consider their Base Line depreciation schedules. Deviations from Base Line should be anticipated but within the foreseeable future we do not anticipate deviations like the ones we saw running up to and immediately following the economic crisis of 2008.
Looking back at the last 30 years, we find that as a rule of thumb, business jets should depreciate at about 9% to 10% annually, but as we indicated aircraft depreciation rates are influenced by a number of factors to include the type of aircraft, global economy, OEM production rates and retail pricing along with engineering and technological developments.